


With the stock market in a free fall since mid-February, this is a time where we go seek assets that “held up”. This is fairly simple to do by checking relative strength (RS). This is not relative strength index (RSI), a lagging indicator that measures how fast and how much a stock’s price change over time; this tells us nothing about a stock’s strength compared to other assets in the market. RS tells us how well a stock is performing in relation to the S&P 500, relative to all other assets in the market. A stock price may actually be going down, but is it going down less compared to other assets, relative the S&P 500? This is where we can find many likely winners!
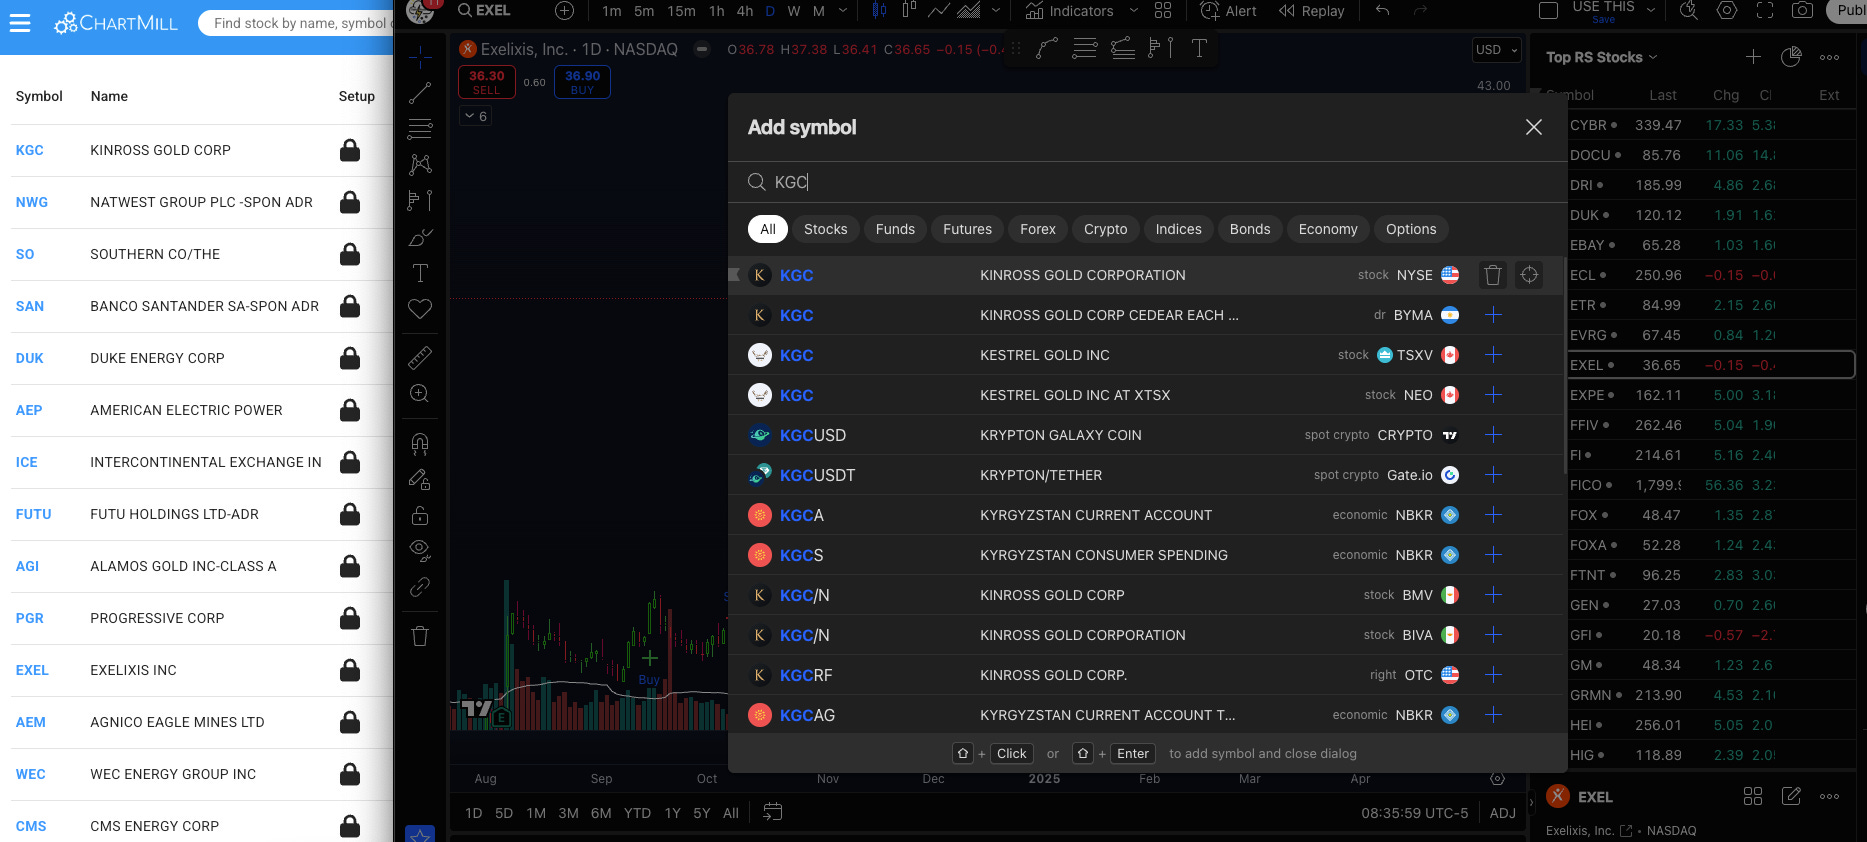
An easy and free way to search for this is Chartmill.com. You will need to register an email, but is well worth the 10 seconds it takes to do that. We can narrow down the thousands of stocks fairly quickly by inputting our general requirements. Note that I am American, so chose “US Only”, but you can use this also to conduct searches for stocks on: Canada, London Stock Exchange, specific European exchanges, Paris, Dublin, Brussels, Zurich and many others Additionally my personal preference are stocks between $10B to $100B and the closest option was $10B to $200B. Maybe you like larger market cap stocks, or smaller. Do whatever you prefer!

Next, I only want to the strongest stocks. Chartmill1 offers a “Relative Strength” option. While most retail are “buying the dip” and dollar cost averaging their portfolios to oblivion, we are looking for stocks already trending up. Its incredible how many people will say “trend is your friend” and then NOT actually follow that advice. Buy high, sell higher. The relative strength on Chartmill evaluates a stock’s performance over the past year compared to all other stocks in their database. A stock with an RS rating of 90 has outperformed 90% of the other stocks in the database over that period. Personally I chose an RS rating of 70. Maybe you chooser higher or lower, but make sure at a very minimum you are above 50. Lets not go fishing at the bottom of the barrel for trash.

To further refine our search results, as we want price action to be trending up, and “support” under price action, I chose 100 simple moving average to be above the 200 simple moving average; and 200 simple moving average also trending up. Additionally I chose positive earnings. Think about it, major investors are not going to be incredibly interested in companies with negative earnings. You may get pumps, from companies with negative earnings…however the longevity of those pumps are typically short lived. With these simple general rules we have narrowed down the list to 133 stocks. That is a manageable number of charts to flip through!
Now, you can go on to add additional filtering criteria if you want, to reduce the 133 stocks even further. However, I prefer conducting a chart analysis individually. I confess the next step is a little tedious…but I assure you, the 15 minutes of labor will pay off over time. I literally start typing every single ticker into Tradingview2. You can have a free Tradingview account which allows you 2 indicators per chart. Personally, I have an upgraded account due to being a chart junkie and I enjoy writing in pinescipt my own indicators.
Once the tickers have been added to Tradingview, the next step is a simple “yes” or “no” to each ticker. Literally spend about 5 seconds on each chart looking for simple criteria:
“Is price action above 200 simple moving average”
“Is price action parabolic at a 12 PM position and too far gone to buy”
“Is the price action consolidating with higher lows for a breakout”
We can quickly eliminate even more charts that are either too far gone, or have fallen below the 200 simple moving average. Personally we target stocks that are consolidating with higher lows and either higher highs or a flat price ceiling. If this is confusing to you, check out the The Breakout Blueprint: By Timothy James or if you want a deep dive for consolidation patterns the Chart Structure Class. Long story short, we target breakouts of volatility contraction patterns, as they offer the highest probability of price action breaking to the upside in a parabolic rise. With this knowledge in hand, you can quickly flag charts to circle back to.
It took about 10 minutes to find 17 stocks with the right price action and chart setups to choose from. From there, we can decide which of those 17 stocks are the best….maybe you want 5 stocks.
👇 Here were the top 5 stocks: 👇

