


Stock Screener Frequently Asked Questions
This will be updated as new questions arise for the Stock Screener

If you have any questions not answered here about the Daily Stock Screener, ask me in the Chat so I can answer you directly.

Where is the screener?
Posted daily here.
Is the Daily Stock Screener available for subscribers or is there an additional cost?
No additional cost. This is solely for subscribers. If we do get too many subscribers, I will close access to the screener and determine an alternative distribution method of the signals. This is to prevent too many people moving in on a single stock at a time, causing liquidity spikes in low volume stocks (which look tasty to market makers). Currently, I am not concerned about too many people.
Will you share the code?
No. Vultures out there will try to repackage it and sell it. They already steal my content and stock picks. Not giving them the keys for an easy ride.
Will you buy every signal the screener puts out?
No; but all of my stock picks will originate from this list. I cannot buy, say 72 stocks, in a single day. I still like to review them myself (I am old and am old school to a degree). If you see a stock you want a 2nd opinion, just ask me in the chat. All of my current positions can be found in the StockTok tracker, here.
How does the screener work?
This is a trend following screener that seeks stocks of strength. This is doubling down on “trend is your friend”. The 2 primary core elements of this screener, is that it scans 4950 stocks and pulls a year’s worth of price action at each pull. Then it ranks the stock’s performance against all of the other stocks. This is the relative strength, not to be confused with relative strength index. Relative strength is how well the stock performs in overall market conditions. For example, if the S&P 500 goes up 1%, but company ABC goes up 3%, and company XYZ goes up only .5%, company ABC will receive a higher relative strength score. It does this comparison against all 4950 stocks.
A short video on how the relative strength is calculated:
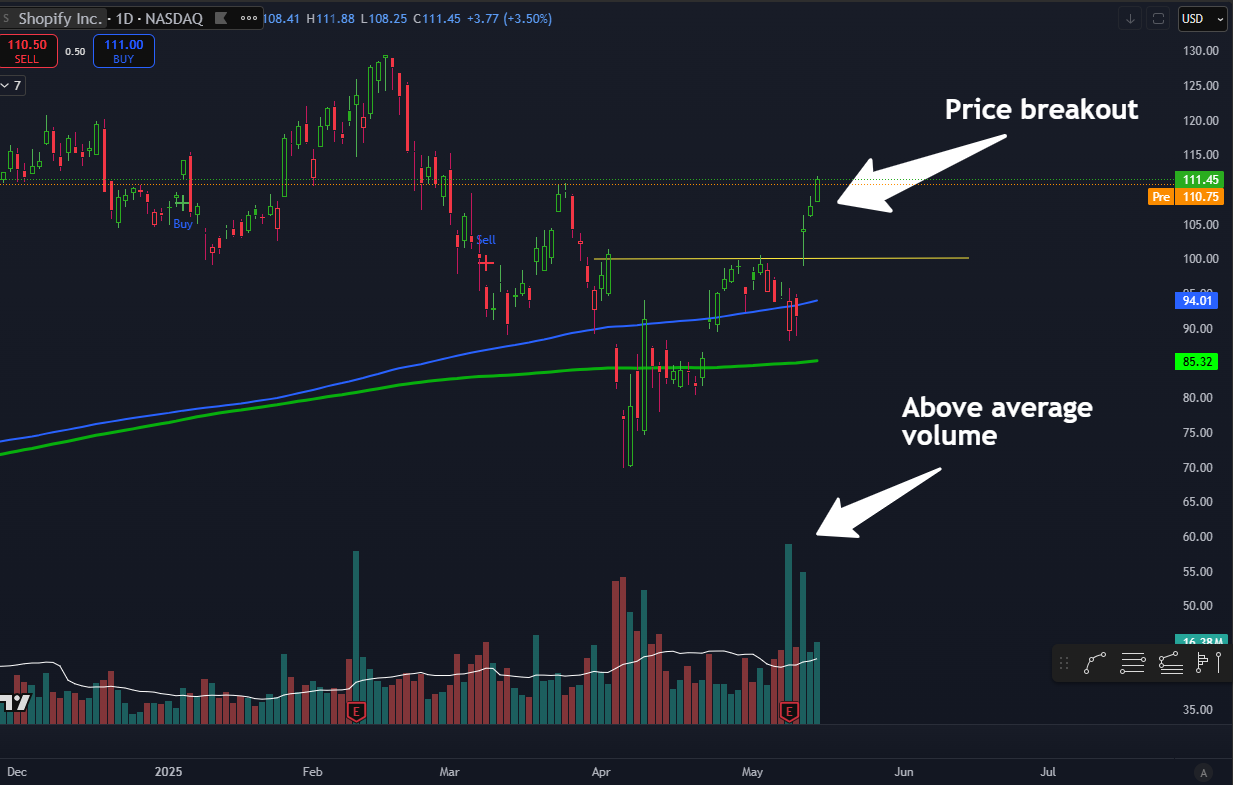
The 2nd key element is a breakout of a consolidation zone. The algorithm examines consolidations, and seeks breakouts with high volume. For example, SHOP (image below) was a recent signal, you can see the image below price breaking out of the higher lows, actually gapping up. The higher volume indicates institutional interest.
This screener is built for bullish mid-term trades (days, weeks), and operates on the daily timeframe (so if you are a day trader, this would be less useful to you). It also only operates when the VIX is below 22. There will be days of “No Signals).
Why are there 2 RS (relative strength) scores? What do they mean?
The smaller RS score is the current day RS score. The larger RS score is the accumulated score over the year. A stock that has been trending well the last year, is more likely to continue trending, and has steady attention from both institutions and retail.
A simple example:
RKLB – RS: 225.76 (RS Value: 99.8) & ROST – RS: 5.05 (RS Value: 70.3)
RKLB has experienced the most growth over the year, and at various points in time, the added RS score is 225.76. ROST on the other hand, even though it has done well, has consolidated more over the year. So its yearly score is lower at 5.05. The RS Value of 99.8 is the present day RS score, indicating that on that day, it was one of the top performing companies. ROST is doing well for the at 70.3.
As I type this, I may just directly label these numbers in the output for ease of understanding (we will improve everyday :)
I bought stock XYZ and it is not on the list today? Is it no good?
Maybe…but that does not mean anything. To prevent redundancy, signals do not print again within a rolling timeframe unless it has another breakout with high volume behind it. So don’t panic about that.
If I see the signal, how do I know where to enter? Or where to exit?
These signals will be posted AFTER market close, that way you have all evening and pre-market to determine your trading plan (something you should do before ANY stock trade). Recall, we are not trying to get “perfect prices” or the “bottom”. We are trying to capture pieces of trend. When I did the performance analysis, I actually took the very top of the signal (assuming you bought at the high), and measured that to May 13th.
Where to enter: Personally I prefer to buy at the breakout of a consolidation, preferably a volatility contraction pattern. This image explains it best (a strategy developed by Mark Minervini, 2 time U.S. Investing Champion). You can see my buys for recent stocks are very similar to this image.
 | Mark Minervini Trading Strategy")
c. Where to exit? You should have a pre-defined stop before you enter any trade. This is to prevent any major losses. You take the risk at the beginning of a trade…not days or weeks later. Once you are in profit, you start reducing your risk by moving your stop up…eventually you will continue moving it up into profit. There is no perfect strategy for this. But those without any form of this strategy are sure to lose, in time. Personally, I try to ride the trend as long as possible, not limiting upside potential. Sometimes you will get stopped out early. Its annoying. But there will be times you will be grateful you got out due to massive pullbacks or market conditions.
What additional trading tools do you recommend to improve my trade and investing performance?
Here you can find all of the trading tools and indicators that I have personally built to aid you (and me) in your trading and investing journey.
Where can I see the test results?
You can review and verify yourself, here. These were publicly shared and most of us have been trading the stock picks selected for a few months now, largely, successfully.
Where does the screener pull data from?
Polygon.io. I have a paid subscription for data.
I bought a stock and it went down.
Welcome to the Stock Market. That happens sometimes. There are no guarantees, and overall market conditions can change in an instant. A tweet can change everything in the blink of an eye. This is why we focus more on risk management, than on profits. Profits come in time…losses come in a flash. Have a trading plan always. You are responsible for your portfolio. If you come crying in the chat, I will probably ignore you or laugh. I take losses sometimes too. It sucks, but its the hard pill that you are required to swallow. You may have a GREAT company…with a GREAT breakout…but the market will say: “Nope, not today”. Recognize when your strategy is not working…and wait for a time you notice your strategy is working, to double down.
How long should I hold?
As long as you can. If a stock is trending in your favor, why cut it? That would be limiting gains.
Will you let us know of updates you do to the screener?
Absolutely. I posted the results publicly. I make no claims of anyone getting rich over night. Markets change, and we change with it or get left behind. Any changes will be documented for your awareness. In fact, if you have ideas or suggestions, share them!

 | Mark Minervini Trading Strategy")
Very cool. Thanks for the FAQ 👍
I'm looking for a strong Entrepreneur to help me Produce and Market my amazing new boardgame www.biznesswiz.com Surely this Fictitious Bizness Oriented game of entrepreneurship! Will be amazingly ultra successful, because this "anti-monopoly" creation deserves to be played by millions of game lovers. Todays game enthusiasts are ready for this fantastic boardgame based on achieving "Full-ownership of companys' stocks while mutually achieving financial gains rather than monopolys' breaking others financially. BiznessWiz truly has the it's Not Over until it's over excitement but doesn't go on and on like monopoly. BiznessWiz concludes with a Full Ownership Winner in average of 1-3 Hrs. depending on Number of players and if playing the Long or Short version... please view our Website and Videos and copy and Paste us an Email. Kind Regards, Mr. BiznessWiz.com